
Price Curve and
Yield Curve Simulator
The market's price for future HEX up top; below, an active chart of what committed HEX earns by any day — with your numbers. Presets load straight from the Strategies playbook.
The Market Price Curve — All Channels, One Chart
Updated 2026-08-28 11:44 UTCBlue = Channel Top
Red = Channel Bottom
Amber Dot = Last Hour's Price
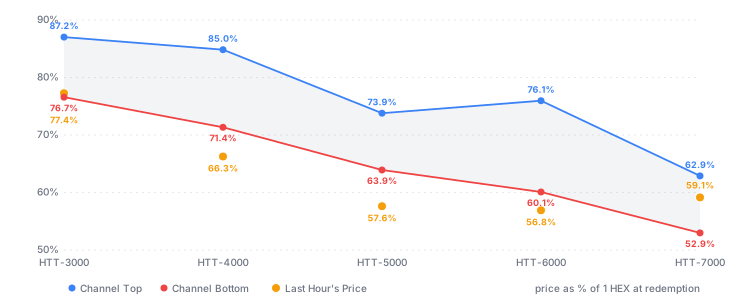
All prices are % of the 1 HEX each token redeems for — the market's price curve for future HEX, drawn from the regression channels on Market Proofs.
- The amber dot's gap below 100% is Last Hour's Discount to HEX — the same number shown on each source chart (Price + Discount = 100%).
- Above the blue line — that series is trading rich to its channel, stretched above its usual range.
- Below the red line — trading cheap to its channel.
- Tendencies, not promises — mean reversion makes such stretches worth watching; on thin pools, always check the volume behind the print.
The Curve as a Table — Against Its Channel
| 3000 | 3030 | 3690 | 4000 | 5000 | 5555 | 6000 | 6666 | 7000 | 7777 | 7900 | 8000 | |
|---|---|---|---|---|---|---|---|---|---|---|---|---|
| Rich | 66 | |||||||||||
| Top | 87.3 | 87 | 86 | 85.0 | 73.9 | 75 | 76.1 | 67 | 62.9 | 53 | 51 | 50 |
| Fair | 77.4 | 82 | 62 | 59.1 | ||||||||
| Bottom | 76.7 | 77 | 73 | 71.4 | 63.9 | 62 | 60.1 | 55 | 52.9 | 47 | 46 | 46 |
| Cheap | 67 | 66 | 57 | 49 | 56 | 36 | 43 | |||||
| Liquidity Pool | $114k | $2k | $7k | $101k | $143k | $8k | $186k | $11k | $309k | $7k | $9k | $34k |
| Series | Rich | Top | Fair | Bottom | Cheap | Pool |
|---|---|---|---|---|---|---|
| 3000 | 87.3 | 77.4 | 76.7 | $114k | ||
| 3030 | 87 | 82 | 77 | $2k | ||
| 3690 | 86 | 73 | 67 | $7k | ||
| 4000 | 85.0 | 71.4 | 66 | $101k | ||
| 5000 | 73.9 | 63.9 | 57 | $143k | ||
| 5555 | 75 | 62 | 49 | $8k | ||
| 6000 | 76.1 | 60.1 | 56 | $186k | ||
| 6666 | 67 | 62 | 55 | $11k | ||
| 7000 | 62.9 | 59.1 | 52.9 | $309k | ||
| 7777 | 53 | 47 | 36 | $7k | ||
| 7900 | 51 | 46 | 43 | $9k | ||
| 8000 | 66 | 50 | 46 | $34k |
- Read a column top to bottom — each column is one series.
- Top and Bottom are the channel levels from the Price Curve above.
- One line per series — its last value lands on exactly one: Rich above its top, Fair inside the channel, or Cheap below its bottom.
- Fitted vs placed — the five charted x000 series carry their own fitted channels; community-created maturities are placed along the curve between them.
All figures are % of the 1 HEX each token redeems for, as of 2026-08-28.
- Community channels — calculated from the curve, not fitted from their own trading history; beyond HTT-7000 they extend the end slope. Read them as rough guides.
- The Pool row — each series’ deepest HTT/HEX pool in dollars (k = thousand, M = million): the number that decides how seriously to take the prints above it.
- Honest rounding — community figures print in whole percents (decimals would be false precision); Rich rounds up, Cheap rounds down.
- The near end is left off — series below HTT-3000 trade on pools a few hundred dollars deep; they would distort the curve, not describe it.
- Thin-pool warning — a Rich print on a thin pool is a warning, not an opportunity. Check pool depth before acting on any line of this table.
Builders: this curve and table are open data — GET hexbonds.com/api/curve.json.
The Yield Curve Simulator — HEX Staking, HTTs & Strategies
The default numbers in the Ladder Table rise from today's 1.6 at the same rate as the projected T-Share Rate displayed on the T-Share Report broadcast on YouTube's HexFire channel.
Show the projection’s inputs
Every point answers one question: if HEX is committed until a given day, what does it earn?
- Blue dots — HEX Time Tokens: buy below 1 HEX today, redeem 1 HEX at maturity. The yield is fixed the moment you buy.
- Green line — native staking, projected: your amount buys T-Shares at today’s rate (boosted by Longer Pays Better and Bigger Pays Better), earning the recent Daily Payout for the whole span. A projection, not a promise.
- Red dashed — Amplified HEX Staking, strategy #9’s loop: stake, mint, sell, restake. It beats plain staking only where an HTT trades rich — and goes negative where it doesn’t. We show that region.
- Hover any point — the tooltip does the math for you, in percent and HEX-in-to-HEX-out.
- Model your own payouts — the table beside the presets is always live: set the payout per T-Share at any future HEX day, and every line recomputes, the red one included.
- One asymmetry — HTTs stay sellable any day; the staking projection assumes locked to the end, and leaving early has penalties.
- Thin pools get called out in their tooltips: a quoted yield is only as real as the liquidity behind it.
Method, stated plainly
- The payout rate — by default the line follows a forward payout ladder (Chrispy’s NSR share-rate path scaling the ruled 1.6 base — rising payouts as old max-length stakes end), editable point by point below. The measured alternative — the average of the last 10 closed days’ payout per T-Share, excluding any day above 2× the 10-day median so one-off spikes don’t flatter the line — is always shown in the inputs and takes over if the ladder points are cleared. The inputs line under the chart states which schedule drew the line you are looking at.
- Facts vs projection — the HTT yields are market facts; future payouts move as total T-Shares and daily inflation move.
- Dots above the line — the market is selling future HEX cheaper than staking is projected to mint it.